
1 Comparing the number of deaths in 2020 and 2021
“History, despite its wrenching pain, cannot be unlived, however, if faced with courage, need not be lived again.”
- Maya Angelou (1928-2014) a famous American writer and civil rights activist who wrote biographies, essays, poetry, and plays. She was awarded over 50 honorary degrees.
In this chapter my goal is to show you the rise in deaths involving Covid from 2020 to 2021 (despite vaccination), and the shocking rise in total deaths from any cause in some age groups from 2020 to 2021 Also I include the current Covid vaccination guidelines. My hope is that you question Covid vaccine efficacy and thus the wisdom of Covid vaccine mandates.
I chose to start this book by comparing the number of deaths that occurred in 2020 and 2021. Seeing these numbers at the beginning of the book, will let you know that we are looking at a new situation- one we have never seen before in our lifetimes. The huge increase in the number of deaths is one reason I oppose Covid vaccine mandates. In most age groups there were many more Covid-related deaths and deaths from all causes in 2021 despite widespread vaccination and continuing to follow Covid mitigation strategies like masking, staying home and social distancing in much of the country.
The Covid vaccines aren’t working as we had been promised. And something is causing a shocking number of non-Covid related deaths. Things we were told to do did not decrease the number of deaths in 2021. Mass vaccination has not stopped the spread of Covid infections either.
Yet, according to the CDC, mass vaccination and boosters are examples of the tools we have to protect ourselves and others from a Covid infection.
On August 11th 2022, the CDC announced changes to its Covid-19 guidance:
“Today, CDC is streamlining its COVID-19 guidance to help people better understand their risk, how to protect themselves and others, what actions to take if exposed to COVID-19, and what actions to take if they are sick or test positive for the virus...with more tools—like vaccination, boosters, and treatments.…The new Covid policies also include spending less time quarantining when infected: to limit social and economic impacts, quarantine of exposed persons is no longer recommended, regardless of vaccination status."
The CDC said, "… spending less time quarantining: to limit social and economic impacts.”
I wonder if the CDC is finally admitting that there has been a massive amount of financial and psychological damage inflicted upon people in the US due to the Covid mandates that they themselves promoted and most state governments enforced?
I wish the CDC had said that they oppose Covid vaccine mandates. If they had, millions more Americans would finally be able to attend higher education, enter the armed forces and work at a wider variety of jobs. If there had never been vaccine mandates, there would be far less financial and psychological pressure on people today.
In my opinion, the school and business closures and vaccine mandates have done more harm than good. Did the CDC make these policy changes based on fewer Covid cases and deaths in August 2022, or were their changes politically motivated?
Cases and Deaths Involving Covid in the US
Below is a chart showing daily new Covid cases in the US (retrieved from Worldometer August 12, 2022). There were a few stretches of time from March 2020 to April 2022 when there were fewer Covid cases than we saw in August 2022 (indicated by the arrows). Also, note that widespread Covid vaccination in 2021 didn’t prevent the massive wave of Covid cases from December 2021 to March 2022. (Vertical lines inserted to show the years.)
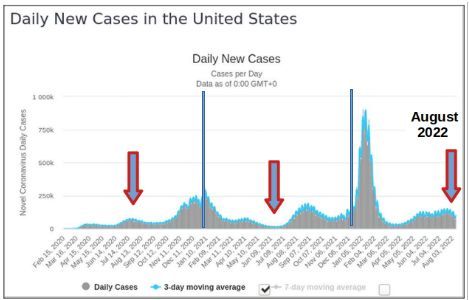
You can see on the Y-axis the number of Corona virus Daily Cases are labeled in 250 thousands: 250k, 500k, 750k and 1,000k. We can see that a sizable number of people in the US have had a Covid infection, which offers them some degree of immunity to future Covid infections. Also, we have to add to the number of cases in the chart above the people who had a Covid infection but never took a Covid test. By now, it is highly likely that the vast majority of people in the US have survived a Covid infection.
Let’s turn to the number of deaths involving Covid in the US:
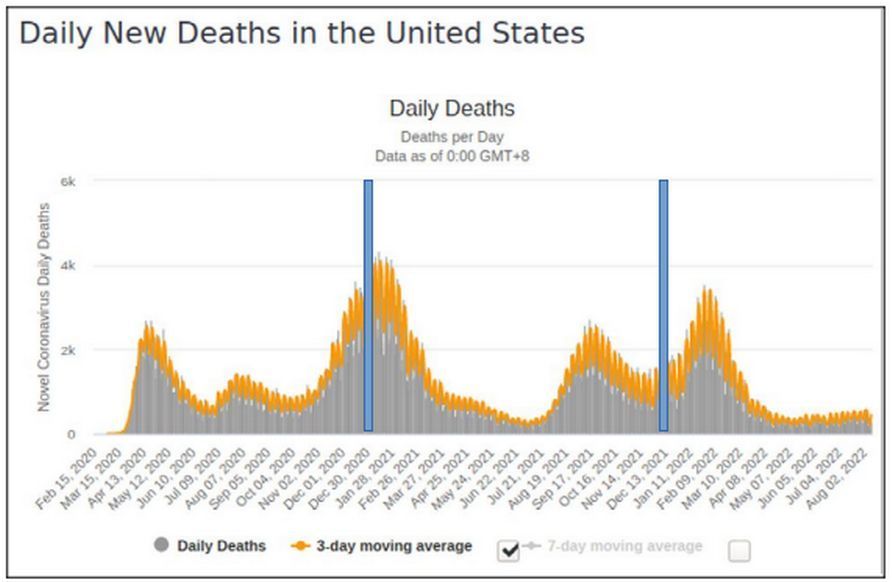
There were five “Covid death waves” in the US between March 2020 and August 2022. Notice the December 2021 to March 2022 death wave that occurred at the same time as the Covid infection wave that we saw in the last chart.
Did Covid vaccination prevent death?
Here is a chart showing the daily count of fully vaccinated people from the CDC (retrieved September 11th 2022). The bold line represents the 7- day running average.
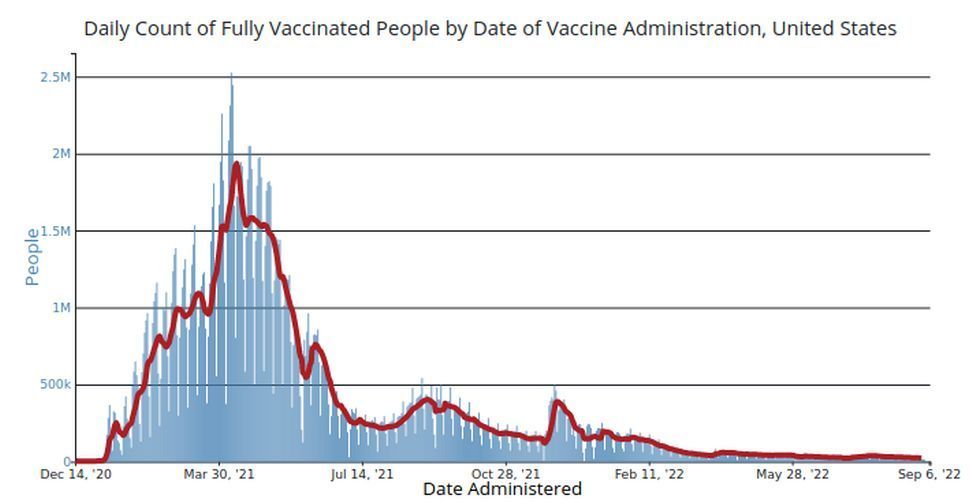
The majority of people were fully vaccinated by the middle of 2021. According to the CDC, by June 24, 2021 vaccinated rates were:
|
Age
|
% Fully Vaccinated |
|
5-11 |
0.4% |
|
12-17 |
26.3% |
|
18-24 |
41.3% |
|
25-49 |
50.4% |
|
50-64 |
66.7% |
|
65 + |
81% |
The majority of people in the US over the age of 25 were fully vaccinated by June 24th 2021 and over 80% of people over the age of 65, who are most at-risk of death from a Covid infection.
Also, people in many areas in the US were also still masking and social distancing in 2021. We would expect to see fewer Covid-related deaths in 2021, right?
Here is the CDC table showing deaths involving Covid and deaths from all causes in the US in 2021 by age group:
|
Year |
Age Group Years |
Deaths involving COVID |
Deaths from All Causes |
|
2021 |
0-17 |
609 |
35,789 |
|
2021 |
18-29 |
3,933 |
68,114 |
|
2021 |
30-39 |
11,575 |
104,177 |
|
2021 |
40-49 |
26,214 |
155,548 |
|
2021 |
50-64 |
103,176 |
610,293 |
|
2021 |
65-74 |
111,693 |
725,850 |
|
2021 |
75-84 |
110,755 |
830,710 |
|
2021 |
85 and over |
95,251 |
941,309 |
Here is the CDC table showing deaths involving Covid and deaths from all causes in the US in 2020 by age group:
|
Year |
Age Group Years |
Deaths involving COVID |
Deaths from All Causes |
|
2020 |
0-17 |
199 |
34,204 |
|
2020 |
18-29 |
1,489 |
63,520 |
|
2020 |
30-39 |
4,294 |
89,319 |
|
2020 |
40-49 |
11,336 |
133,464 |
|
2020 |
50-64 |
56,802 |
557,214 |
|
2020 |
65-74 |
82,332 |
675,940 |
|
2020 |
75-84 |
106,319 |
823,038 |
|
2020 |
85 and over |
122,895 |
1,013,340 |
Comparing the number of Deaths from all causes and the number of Deaths involving Covid in 2020 to those in 2021
I realize we are comparing roughly 9 months of deaths involving Covid in 2020 to 12 months of deaths involving Covid in 2021. However, even if we subtract 25% of the Covid deaths in 2021 to compare roughly 9 months to 9 months, we still see a substantial increase in Covid related deaths in all age groups in 2021 despite vaccination, except for in the 75-84 and 85+ age groups. Recall the percentage of people fully vaccinated by June 24th 2021:
|
Age
|
% Fully Vaccinated |
|
5-11 |
0.4% |
|
12-17 |
26.3% |
|
18-24 |
41.3% |
|
25-49 |
50.4% |
|
50-64 |
66.7% |
|
65+ |
81% |
Let’s compare how many people died in 2020 and 2021, first from all causes (which include Covid) and then deaths involving Covid (numbers below are from the CDC).
Deaths from all causes and Deaths involving Covid
Comparing 2020 and 2021
|
Age
|
Deaths from all causes 2020
|
Deaths from all causes 2021
|
|
Deaths involving Covid 2020
|
Deaths involving Covid 2021
|
Subtracting 25% of 2021 deaths involving Covid |
|
0-17 |
34,204 |
35,789 |
|
199 |
609 |
457 |
|
18-29 |
63,520 |
68,114 |
|
1,489 |
3,933 |
2,950 |
|
30-39 |
89,319 |
104,177 |
|
4,294 |
11,575 |
8,681 |
|
40-49 |
133,464 |
155,548 |
|
11,336 |
26,214 |
19,660 |
|
50-64 |
557,214 |
610,293 |
|
56,802 |
103,176 |
77,382 |
|
65-74 |
675,940 |
725,850 |
|
82,332 |
111,693 |
83,770 |
|
75-84 |
823,038 |
830,710 |
|
106,319 |
110,755 |
83,066 |
|
85+ |
1,013,340 |
941,309 |
|
122,895 |
95,251 |
71,438 |
Deaths from all causes
The number of deaths from all causes increased in 2021 in all age groups except for 85+, which saw a 7.1% decrease. The bolded numbers in the Deaths from all causes 2021 column signify a +9% increase or more. Why did so many more people die between the ages of 30-64 in 2021?
Let’s look specifically at three different age groups to see the percentage of each group’s total population who didn’t die from any cause in 2020 when there was Covid and no Covid vaccine:
1- I’m in the 50-64 year old age group. There are 62.8 million of us in the US. In 2020, 557,214 people age 50-64 died from something, not necessarily Covid. That equates to 0.9% of us dying in 2020 and 99.1% of us surviving.
2- Let’s look at my son’s age group. He is part of the 30-39 year old age group. There are 44.7 million people in his age group. In 2020, 89,319 people age 30-39 died from something. That equates to 0.2% of people in his age group dying in 2020 and 99.8% of them surviving.
3- Let’s look at children’s risk of dying from any cause, age 0-17. There are 71.3 million children in the US. In 2020, 34,204 children died from something.
That equates to 0.048% children dying from something in 2020 and 99.952% of them surviving.
Deaths involving Covid
The number of deaths involving Covid increased in 2021 from 2020 in all age groups except for the 85+ age group. When comparing 9 months to 9 months, the number of deaths involving Covid still increased in all age groups except for in the 75-84 and 85+ age groups. I seriously doubt the efficacy of Covid vaccines.
In the 50-64 age group there was a dramatic near 82% increase in deaths involving Covid in 2021. If we adjust the number of deaths in 2021 so that we are comparing roughly 9 months to 9 months, we still see a substantial increase of 36%. A near 67% of that population was fully vaccinated before the August-December 2021 wave of Covid infections. What accounted for the huge increase in Covid related deaths when no one in that age group was vaccinated in 2020?
In the 65-74 age group, even when adjusted by 25% and even with a 81% vaccination rate, the number of Covid related deaths in 2021 (83,770) was more than the number in 2020 (82,332). I found that surprising.
All of these increases in death, whether from Covid or from any cause, occurred despite widespread vaccination in 2021 and widespread continuation of Covid mitigation strategies, like masking, school and business closures and social distancing in many states.
Let’s look at the chart again more closely to examine the dramatic increase in deaths from all causes and deaths involving Covid in the 30-64 year old age groups to see the percentage increase. I put in the number of deaths related to Covid adjusted for time to compare 9 months to 9 months.
|
Age
|
Deaths from all causes 2020
|
Deaths from all causes 2021
|
% increase
|
Deaths involving Covid 2020
|
Deaths involving Covid 2021 (adjusted) |
% increase
|
|
30-39 |
89,319 |
104,177 |
16.6% |
4,294 |
8,681 |
102% |
|
40-49 |
133,464 |
155,548 |
16.5% |
11,336 |
19,660 |
73% |
|
50-64 |
557,214 |
610,293 |
9.5% |
56,802 |
77,382 |
36% |
It didn’t make sense to me that so many more people had a death involving Covid in 2021 when over 50% of the population age 25-64 were fully vaccinated and therefore should have been especially protected them from the wave of deaths August to December 2021. Covid vaccines haven’t been working as we had been promised. I imagine many other people were keeping track of the Covid-related deaths in 2020 and 2021 too and were as surprised by these numbers as I was.
What are the current (September 12th 2022) Covid vaccination guidelines and rates in the US?
Here are the current CDC Covid vaccination guidelines for people in the US: “COVID-19 vaccination is recommended for everyone ages 6 months and older in the United States for the prevention of COVID-19. CDC recommends that people get up to date with COVID-19 vaccination. There is currently no FDA-approved or FDA-authorized COVID-19 vaccine for children younger than age 6 months.”
According to the CDC, a total of 67.6% of the entire population is fully vaccinated in the US. 77.4% of the population over the age of 18 is fully vaccinated and 92.1% of the population over the age of 65 are fully vaccinated.
Here are the vaccination rates as of September 12, 2022 according to the CDC data tracker:
|
Age
|
% Fully Vaccinated |
|
Under 2 |
1.1% |
|
2-4 |
2% |
|
5-11 |
31.3% |
|
12-17 |
60.6% |
|
18-24 |
65.1% |
|
25-49 |
70.6% |
|
50-64 |
82.4% |
|
65+ |
92.2% |
Our response to the SARS-CovV-2 virus and the results of mass Covid vaccination will end up in future history books.
In the next chapter we will look at shocking news out of Canada and Washington state.